Published on January 15, 2020

 Studies have shown that an Omega-3 Index greater than 8% is optimal and less than 4% is deficient, particularly for cardiovascular health. Yesterday, we presented information from a GrassrootsHealth analysis on omega-3 status and data from a recent publication summarizing fatty/oily fish consumption in the UK population. In today’s blog we will explore Omega-3 Index results according to fatty fish consumption among those not taking an omega-3 supplement.
From 486 GrassrootsHealth participants who have results from an Omega-3 Index test and reported not taking any omega-3 supplement, we calculated the percent who achieved an Omega-3 Index of less than 4%, 4% to 5.9%, 6% to 6.9%, and 8% or higher by weekly fatty fish intake. The chart below shows that more than one-third (39%) of those consuming no fatty fish had an Omega-3 Index less than 4% and only 9% had an index of 6% or higher. Among those consuming 3 or more servings of fatty fish per week, only 2% had an index less than 4% while 50% had an index of 6% or higher (with 20% at an index of 8% or higher).
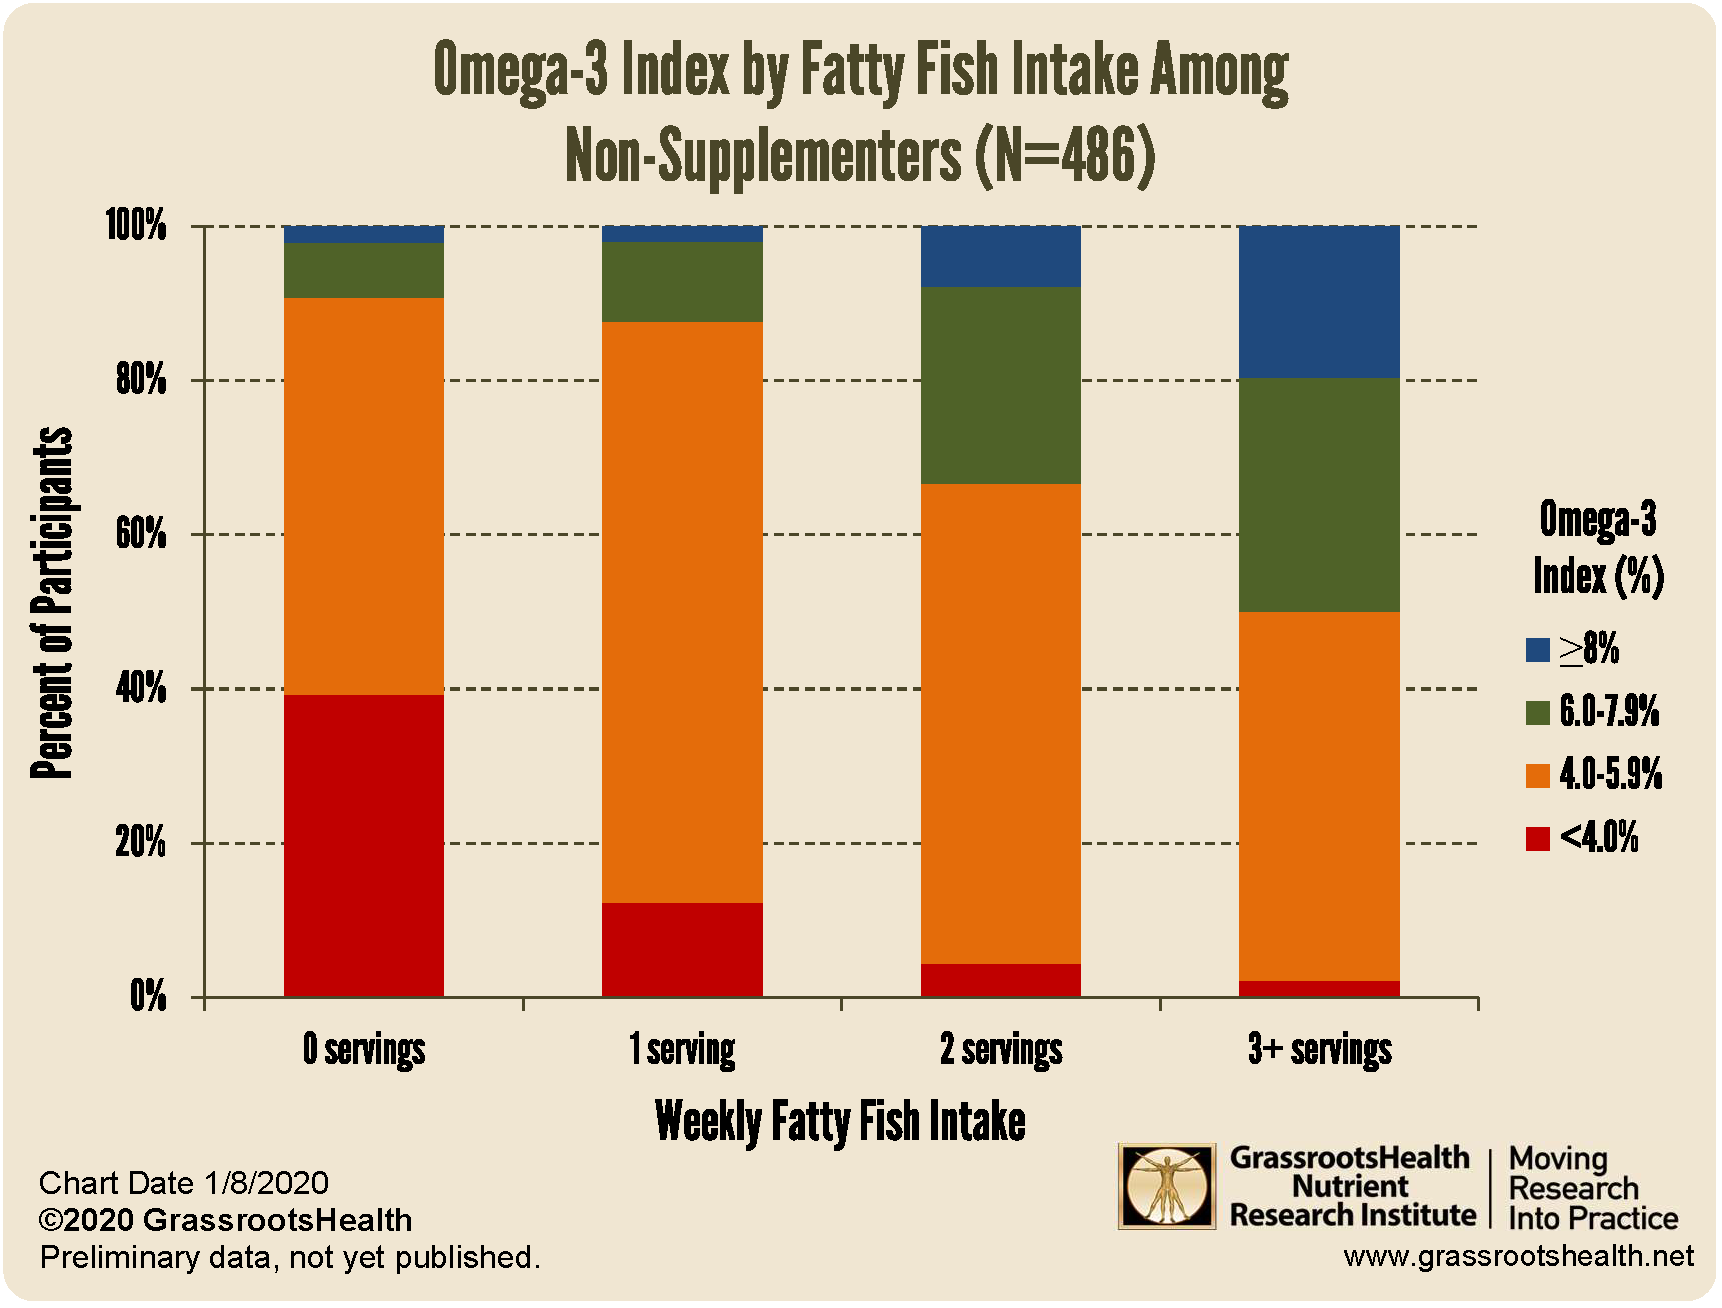
This preliminary analysis suggests that more than 3 servings per week of fatty fish are needed on average to achieve an Omega-3 Index of 8% or higher with fish intake alone.
In addition to increasing overall fatty fish consumption, it may be useful to consider the EPA and DHA content of different fish species and opt for those with higher amounts. Another option to help boost omega-3 status would be the addition of an omega-3 supplement with EPA and DHA. We encourage you to use the Omega-3 Calculator to determine an estimated amount of how much more EPA and DHA you may need to achieve your target level.
Are you getting enough Omega-3 fatty acids?
Is your dietary and supplemental intake of omega-3s enough to ensure an Omega-3 Index of at least 8%? Make sure you know your vitamin D level, and take steps to keep it within a target of 40-60 ng/ml or 100-150 nmol/L! Through GrassrootsHealth Nutrient Research Institute, you can also test your essential elements magnesium, copper, zinc and selenium, toxins such as lead, mercury and cadmium, as well as your omega-3 levels, inflammation levels and thyroid stimulating hormone (TSH) level. Find out your levels today! Log on to the test selection page (click the link below) to get your tests and see for yourself if your levels can be improved.
Make sure you track your results before and after, about every 6 months!
Click Here to Access the Test Page
How can I track my nutrient intake and levels over time?
To help you track your supplement use and nutrient levels, GrassrootsHealth has created an online tracking system called myData-myAnswers. For each specific supplement, you can track what days you take it, how much, and many other details. This will help you know your true supplemental intake and what patterns of use work for you to reach and maintain optimum nutrient levels. Check it out today!
How Can You Use this Information for YOUR Health?
Having and maintaining healthy vitamin D and other nutrient levels can help improve your health now and for your future. Measuring is the only way to make sure you are getting enough!
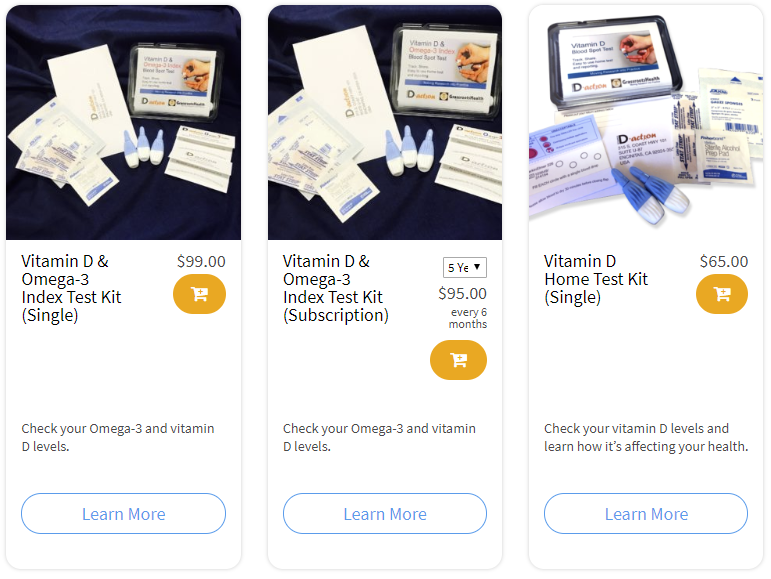
STEP 1 Order your at-home blood spot test kit to measure vitamin D and other nutrients of concern to you, such as omega-3s, magnesium, essential and toxic elements (zinc, copper, selenium, lead, cadmium, mercury); include hsCRP as a marker of inflammation or HbA1c for blood sugar health
STEP 2 Answer the online questionnaire as part of the GrassrootsHealth study
STEP 3 Using our educational materials and tools (such as our dose calculators), assess your results to determine if you are in your desired target range or if actions should be taken to get there
STEP 4 After 3-6 months of implementing your changes, re-test to see if you have achieved your target level(s)