Published on December 7, 2020
Statistical Significance – How important is the p-value and what does it mean?
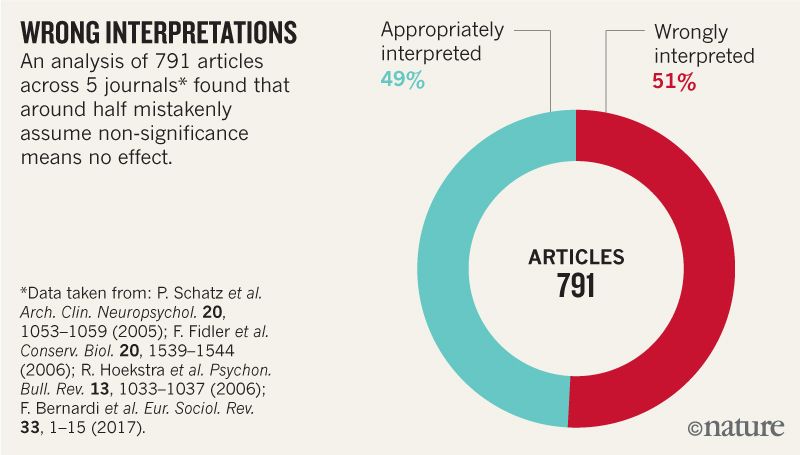
A large group of scientists now agree that statistical significance is confusing research conclusions from all sorts of studies, including those on vitamin D!
A statement released by the American Statistical Association in 2016 warned against the misuse of statistical significance and P values. Since then, a commentary article published in Nature called for the abandonment of the concept of statistical significance. Prior to publication, the article was signed and endorsed by more than 850 statisticians, researchers, and other scientists from around the world – whose past or present work depends on statistical modelling.
The article highlights the problem in detail, and states that scientists
“should never conclude there is ‘no difference’ or ‘no association’ just because a P value is larger than a threshold such as 0.05 or, equivalently, because a confidence interval includes zero. Neither should we conclude that two studies conflict because one had a statistically significant result and the other did not. These errors waste research efforts and misinform policy decisions.”
Source: V. Amrhein et al.
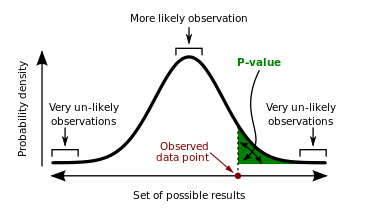
What is “statistical significance” and what does it mean for vitamin D?
“Significance” in scientific research terms is a computation done during data analysis to evaluate the strength of the evidence. It is also called the P value.
An example of how a P value can be reported can be seen in the following statement, taken from the abstract of Lappe et al., JAMA 2017, a study looking at cancer incidence among 2303 women over a 4 year period, using either vitamin D + calcium or placebo:
“A new diagnosis of cancer was confirmed in 109 participants, 45 (3.89%) in the vitamin D + calcium group and 64 (5.58%) in the placebo group (difference, 1.69% [95% CI, -0.06% to 3.46%]; P=.06).”
The P value is a probability, a percentage. In this calculation, the P value was .06, which means that there is a 6% chance that this result (30% reduction in cancer in the vitamin D + calcium group) was due to chance – not the actual treatment. In a different wording, that means you are 94% sure it was NOT chance! It is standard practice within the scientific community that P=.05 or less is an accepted amount for study results to have “significance” and anything higher than P=.05 is “not statistically significant.” There is no middle ground, it is black or white.
Does “not statistically significant” mean “no difference”?
The abstract, or summary of the paper, is often all that people see unless they subscribe to the journal or pay for the paper. When a layman reads this text, it can be understood to mean that there wasn’t a meaningful reduction in risk. For example, the conclusion from the Lappe et al. abstract reads:
“Conclusions and Relevance – Among healthy postmenopausal older women with a mean baseline serum 25-hydroxyvitamin D level of 32.8 ng/ml, supplementation with vitamin D3 and calcium compared with placebo did not result in a significantly lower risk of all-type cancer at 4 years. Further research is necessary to assess the possible role of vitamin D in cancer prevention.”
A look at the chart below illustrating the results from this study may portray a different conclusion.
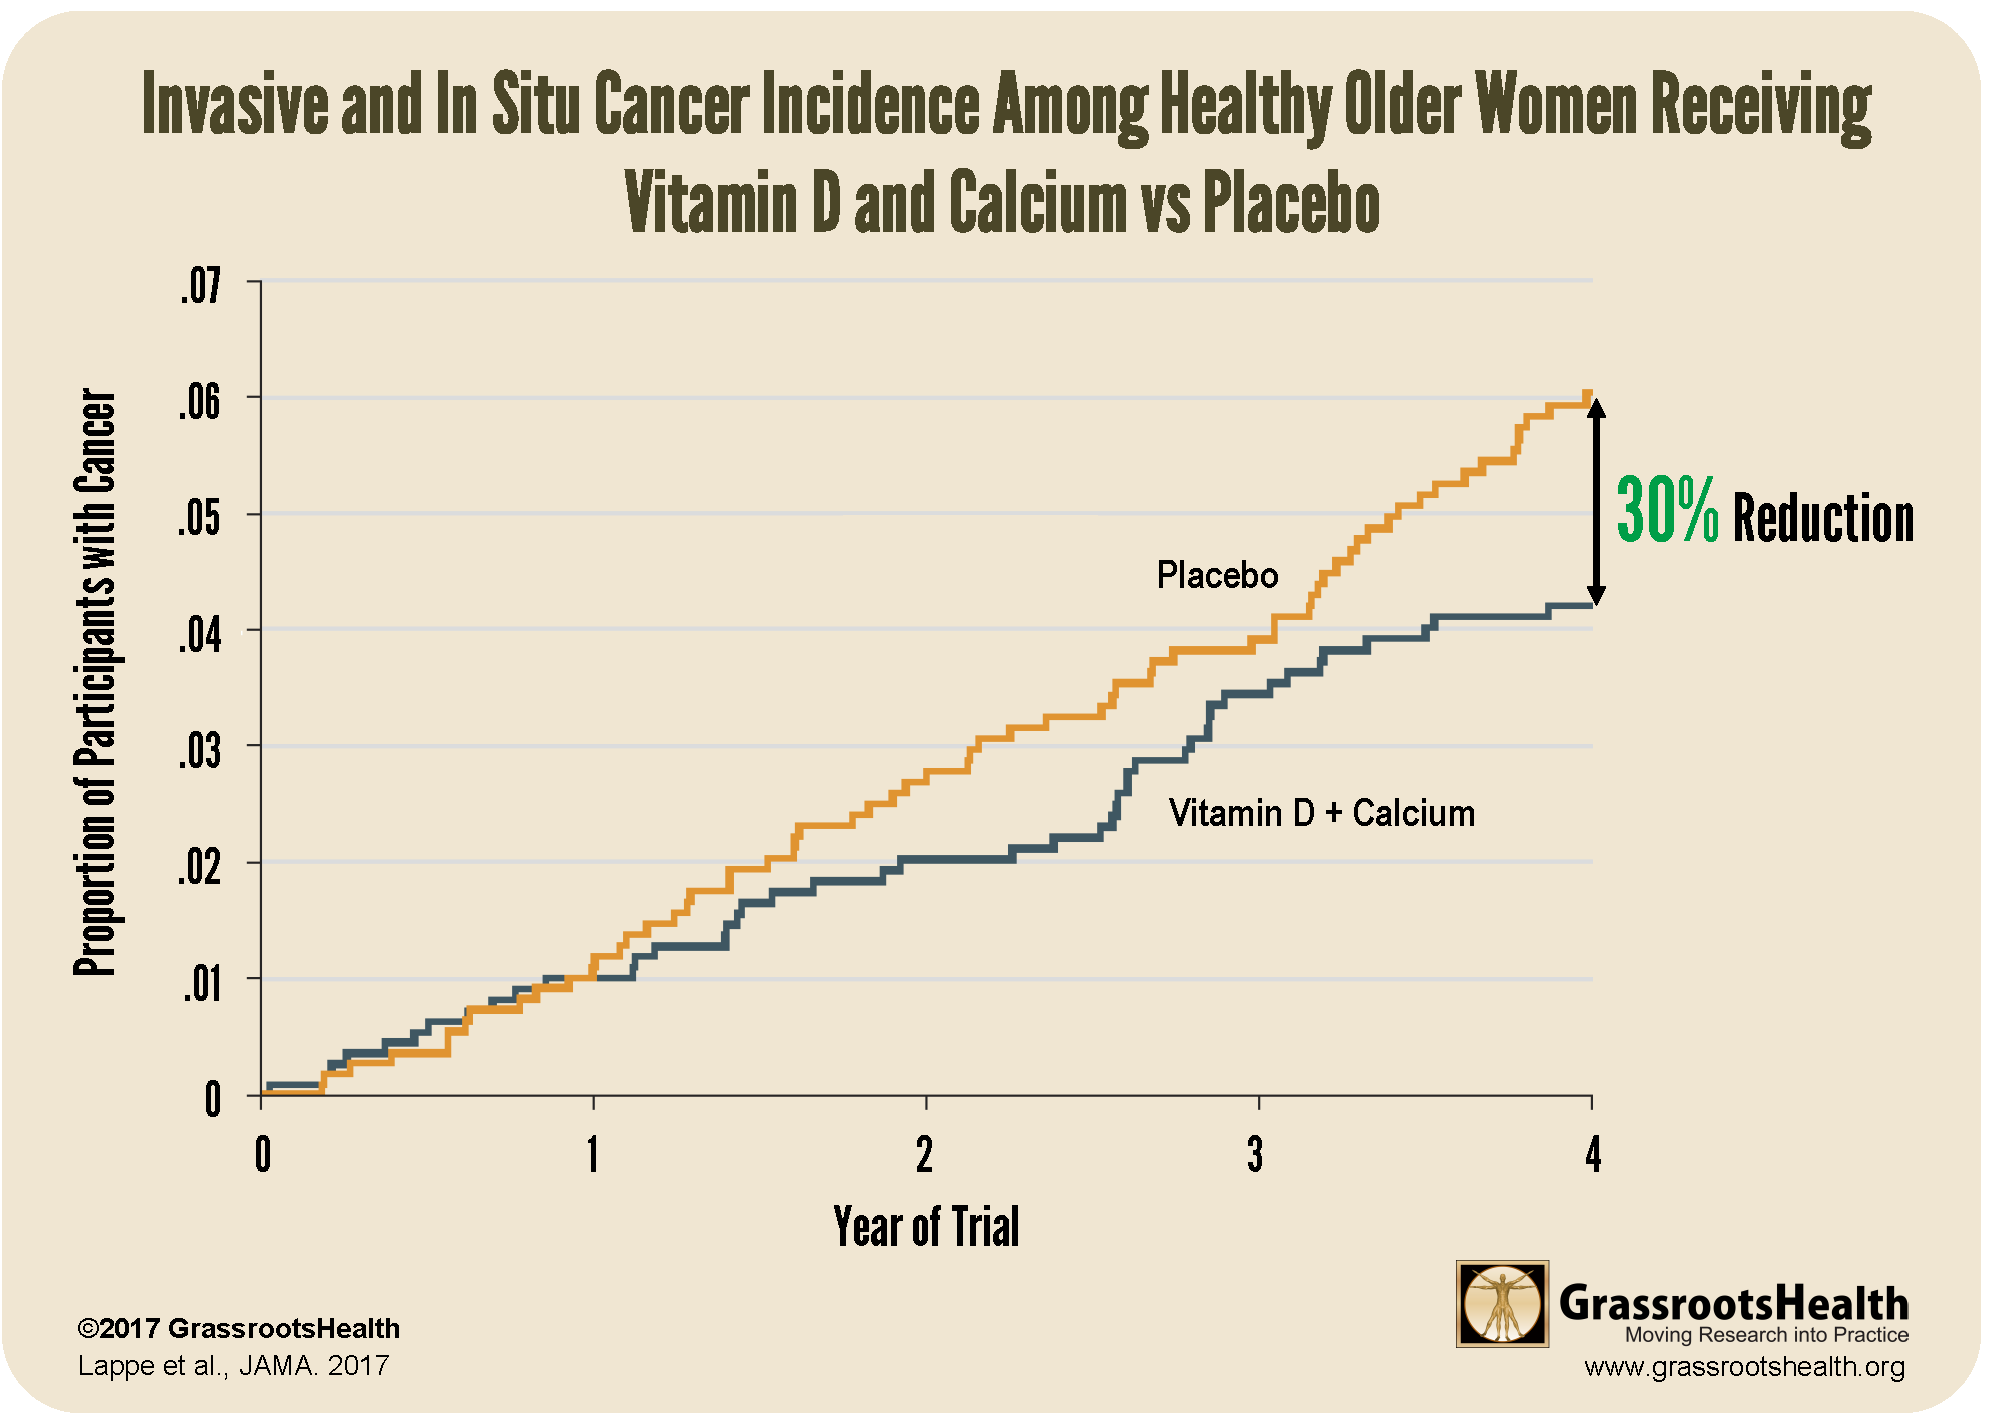
The initial analysis by treatment group showed a 30% reduction, with a P value of .06. Because the P value was greater than the .05 cut-off, it was labeled “not statistically significant.”
However, when participants who withdrew from the study or developed cancer within the first 12 months were excluded from analysis, the study reports a 35% reduction in cancer in the vitamin D + calcium group compared to the placebo group (P-value = .047). This was a “statistically significant” difference.
Why would they take out year 1 data?
The chart above explains it well if you are a visual person. For the two groups, cancer incidence was almost identical in the first year. You can see the yellow and blue lines are on top of each other. After a year they start to separate. Simply put, removing the first year excludes those whose cancer was already progressing but not yet diagnosed, and it allowed time for vitamin D to “do its job.”
Even without removing the first year of data, we ask you this… should the original conclusion showing a 30% reduction in cancer be ignored because the P value was .01 greater than what scientists have labeled as acceptable? How would you interpret this information to help you make your own health decisions?
How does this apply to D*action?
One of the ways to improve statistical power (i.e. the ability to detect a significant result if one exists) is to use a larger sample size. The more people that test their levels and fill out the D*action questionnaire, the better research we are able to conduct!
Could Vitamin D Make a Difference for YOUR Health?
Correcting a vitamin D deficiency at any age and any time of life may decrease potential disease incidence and severity, and improve outcomes! Test your vitamin D level today, learn what steps to take to improve your level, and take action to achieve and maintain a vitamin D level of 40-60 ng/ml (100-150 nmol/L).
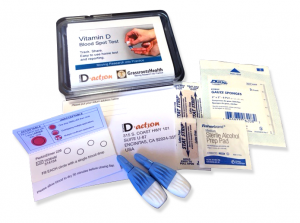
Using the GrassrootsHealth Custom Kit Builder, you can create a test kit that measures your status of vitamin D and other important nutrients (such as omega-3s, zinc and magnesium), as well as your CRP level to measure inflammation. Click here to build and order your test kit today – measure your status and take the steps necessary to improve them if needed; make an impact on your health today and for your future! When you know what your levels are, you can determine next steps to take and how much supplementation may be needed if you are not at your target levels.
Enroll now with the Full Immune Boost Panel (which includes tests for vitamin D, Omega-3 Index, magnesium, zinc, selenium, copper, and hsCRP), and get 10% off when you use coupon code BoostTen at checkout.
How Can You Use this Information for YOUR Health?
Having and maintaining healthy vitamin D and other nutrient levels can help improve your health now and for your future. Measuring is the only way to make sure you are getting enough!
STEP 1 Order your at-home blood spot test kit to measure vitamin D and other nutrients of concern to you, such as omega-3s, magnesium, essential and toxic elements (zinc, copper, selenium, lead, cadmium, mercury); include hsCRP as a marker of inflammation or HbA1c for blood sugar health
STEP 2 Answer the online questionnaire as part of the GrassrootsHealth study
STEP 3 Using our educational materials and tools (such as our dose calculators), assess your results to determine if you are in your desired target range or if actions should be taken to get there
STEP 4 After 3-6 months of implementing your changes, re-test to see if you have achieved your target level(s)
You may also like
 Reducing COVID-19 Risks and Improving Patient Survival – A Summary of Research on Vitamin D, Other Nutrients & Immune Health
 What do Randomized Controlled Trials Say about Vitamin D and Cancer?
 Roles of Vitamin D in Cancer Prevention