Published on June 11, 2019
 Studies have linked lower vitamin D levels with a higher risk of developing type 2 diabetes as well as impaired pancreatic beta-cell function and insulin resistance. Last week (June 7, 2019), results from a randomized clinical trial assessing whether vitamin D supplementation reduces the risk of type 2 diabetes among adults with prediabetes were published in The New England Journal of Medicine. In this trial, participants were assigned to take either 4000 IU/day of vitamin D or placebo for an average of 2.5 years. Having a low vitamin D level was not an eligibility requirement and participants were allowed to take up to 1000 IU/day of non-study vitamin D supplements prior to and during the study. The primary outcome was the diagnosis of type 2 diabetes based on glycemic testing (amount of glucose in the bloodstream) during the study period.
What were the findings of the study?
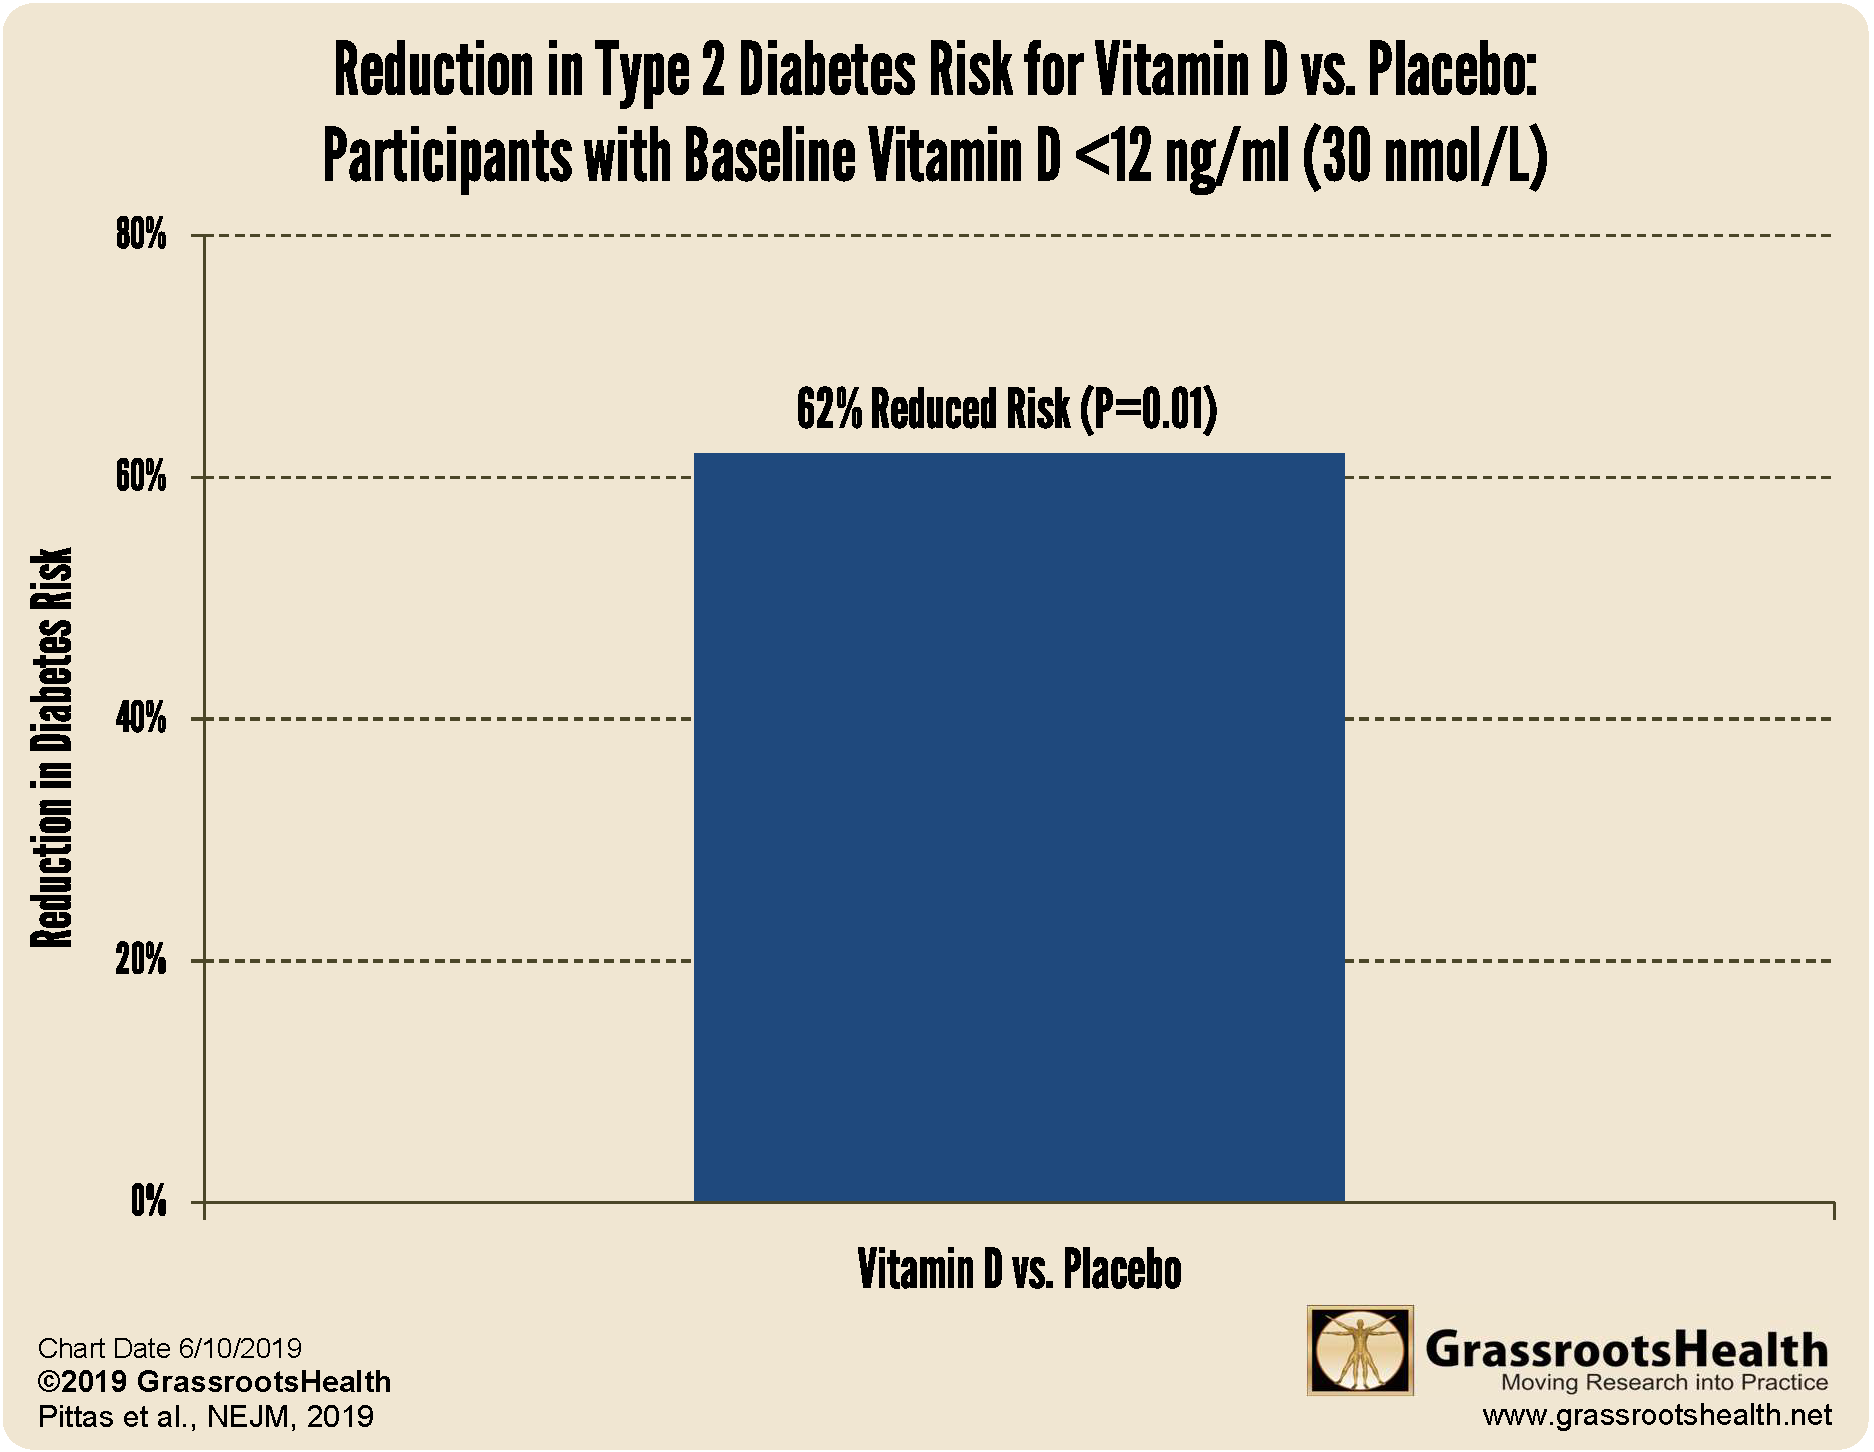
Among 2,423 study participants, the average starting vitamin D level was 28 ng/ml (70 nmol/L) with 78% having a vitamin D level of 20 ng/ml (50 nmol/L) or higher. After one year, those in the vitamin D group achieved an average vitamin D level of 52 ng/ml (131 nmol/L) whereas the average vitamin D level remained at 28 ng/ml (70 nmol/L) in the placebo group. In “intent-to-treat” analyses, which includes all participants regardless of whether or not they adhered to the study protocol, participants in the vitamin D group had a 12% reduced risk of type 2 diabetes compared to participants in the placebo group (P=0.12); however, this result did not reach statistical significance at the 0.05 threshold. When only those with a very low starting vitamin D level (less than 12 ng/ml or 30 nmol/L) were assessed, those in the vitamin D group had a 62% reduced risk of type 2 diabetes compared to those in the placebo group (P=0.01, figure below). Almost all subgroup analyses, such as by race and sex, also favored vitamin D. Notably, among participants with a BMI less than 30, those in the vitamin D group had a 29% reduced risk of type 2 diabetes compared to the placebo group (P=0.02).
In addition, the researchers found that more participants in the placebo group started weight-loss or diabetes medication and took non-study vitamin D supplements above the limit of 1000 IU/day. Also, more participants in the vitamin D group stopped taking their study supplements. In “per-protocol” analyses, which excluded participants when they discontinued study supplements, took more than 1000 IU/day of non-study vitamin D, or started weight-loss or diabetes medication, participants in the vitamin D group had a 16% reduced risk of type 2 diabetes compared to participants in the placebo group (P=0.05).
Why didn’t this clinical trial find a more significant vitamin D effect?
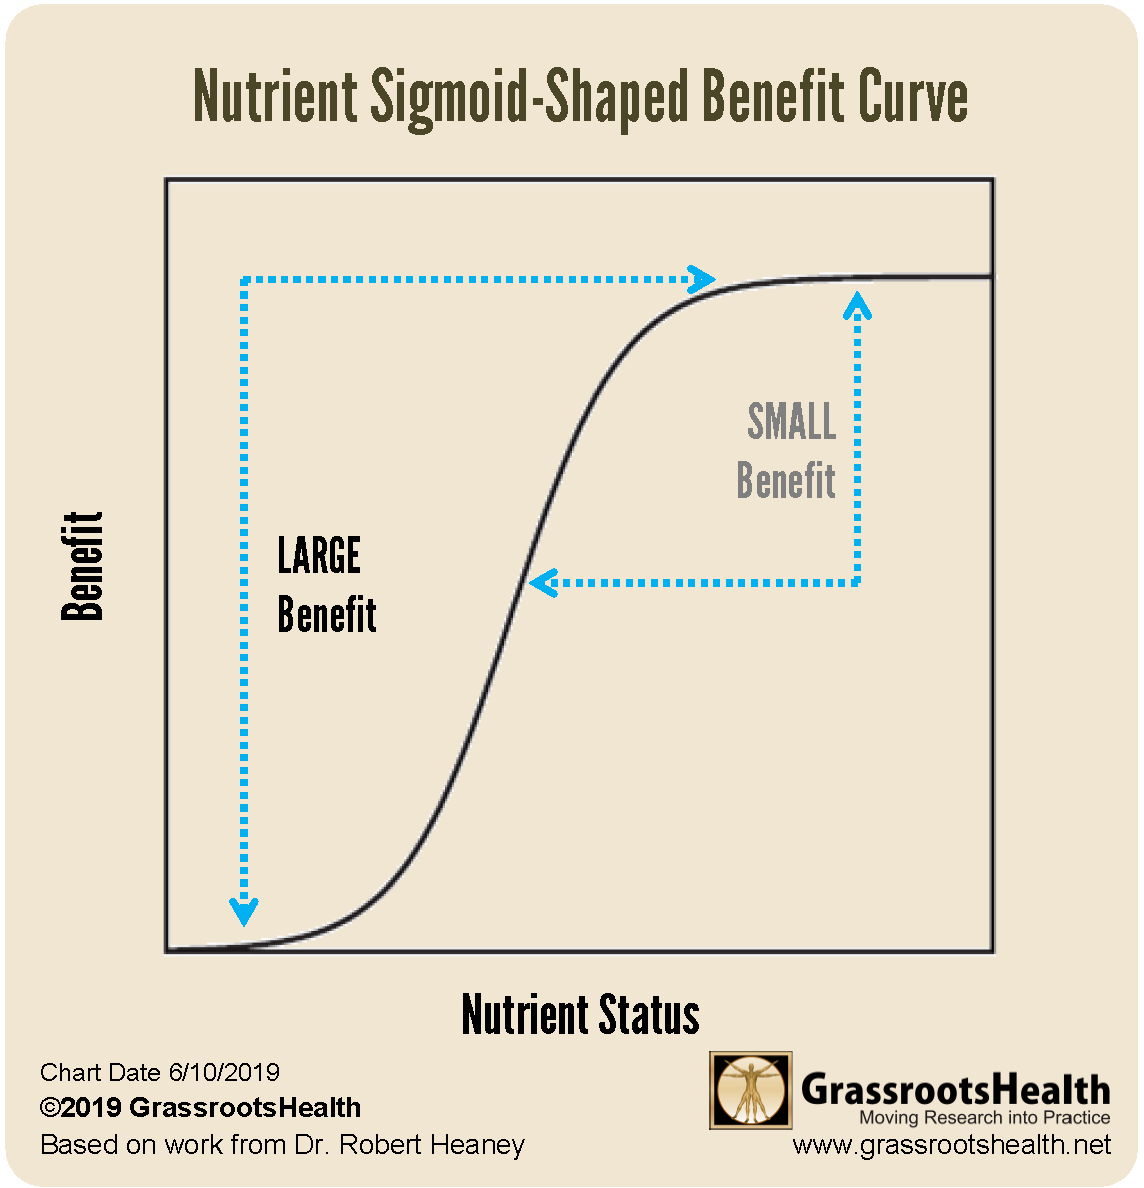
The relationship between nutrient status and benefit is a sigmoid-shaped curve, as illustrated in the figure below. The measureable benefit is often found within a narrow response region, with a flat response above and below this region. The greatest benefit will be for an individual whose levels rise from below the response range to above it. For individuals who start with a higher vitamin D level, the effect will be small or null. A previous study by GrassrootsHealth found that the association between vitamin D status and insulin resistance, a precursor of diabetes, was in the range of 16-36 ng/ml (40-90 nmol/L); with no measurable benefit found above 32-36 ng/ml (80-90 nmol/L). The average starting vitamin D level in the D2d clinical trial was 28 ng/ml (70 nmol/L), therefore many participants were already near the top of the response range for insulin resistance, resulting in a small expected benefit. The significant reduced diabetes risk (62%) for those with vitamin D levels less than 12 ng/ml at baseline also illustrates this point. By not restricting enrollment to only those with levels below or at the lower end of the response range, the D2d study was simply not designed to assess the full vitamin D effect and did not have the number of participants and length of follow-up time necessary to detect a smaller effect size which would be expected among participants with higher starting vitamin D levels.
Also, since this clinical trial was among those with prediabetes based on increased glucose intolerance, many participants may have already experienced a loss of function of beta-cells. Beta cells are cells within the pancreas that produce and release insulin into the bloodstream. Based on the natural progression of type 2 diabetes, vitamin D supplementation likely needs to start earlier, prior to loss of beta-cell function, to maximize vitamin D effect. Further, study design and interpretation by vitamin D levels, rather than by assigned intake, is key to assessing vitamin D benefit since individuals can respond very differently to a given dose. Also, vitamin D levels account for other vitamin D inputs such as from food, the sun, and non-study supplements.
How can I find out if I’m at risk for diabetes?
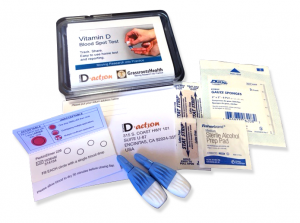
GrassrootsHealth offers a Hemoglobin A1c dried blood spot test, which provides information about the average blood glucose levels over the prior few months. Generally levels below 5.7% are considered normal, 5.7% to 6.4% are considered prediabetic, and levels of 6.5% or higher are considered diabetic. This test can be used by a healthcare professional, along with other tests and a physical exam, to help diagnose type 2 diabetes and prediabetes and for diabetes management. Knowing your Hemoglobin A1c levels can enable you to focus your health efforts on lifestyle changes, such as diet, exercise, and improving vitamin D and omega-3 status, which can help prevent or even reverse prediabetes. Be sure to consult your physician if you think you are at risk for diabetes and for specific recommendations for your health.
Find out your levels today! Log on to the shop (click the link below) to get your tests and see for yourself if your levels can be improved.
Make sure you track your results before and after, about every 6 months!
Click Here to Access the Shop Page
How can I track my Vitamin D and Hemoglobin A1c levels?
To help you track your Vitamin D and Hemoglobin A1c levels, GrassrootsHealth has created an online tracking system called myData-myAnswers. You can also track your omega-3 levels as well as your diet, weight and exercise to see how they impact your Hemoglobin A1c levels. Check it out today!


