Published on May 13, 2019

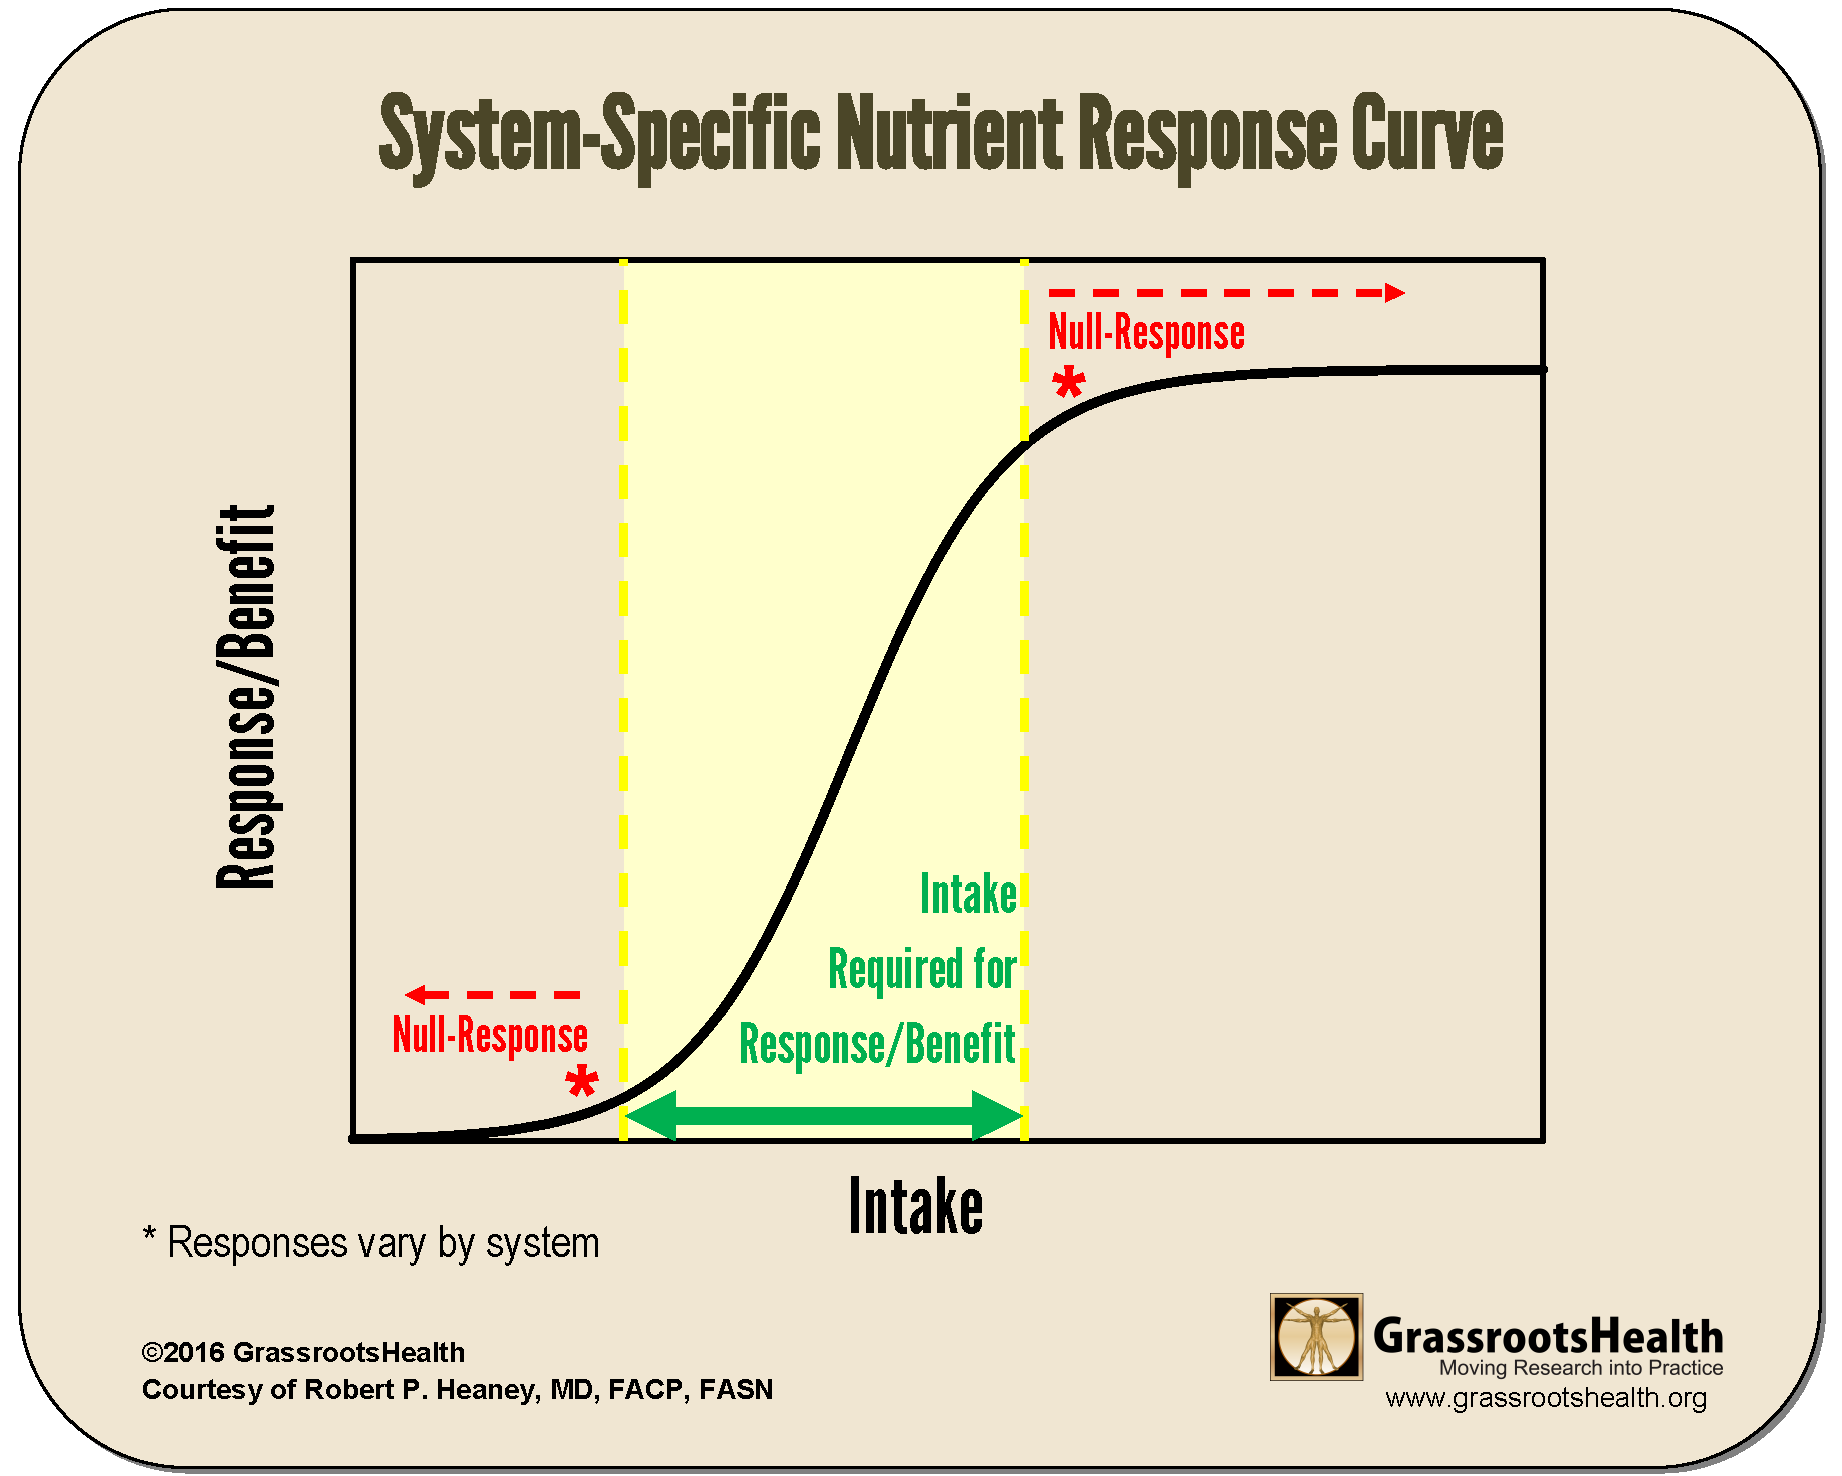
The way the body responds to most nutrients can be described by an ‘S’ shaped curve, or Sigmoid Response Curve, such as described in the Nutrition and Medicine Webinar by Dr. Robert Heaney (from approximately 10:36 to 18:35). Understanding this curve is important to be able to define the appropriate amount of the nutrient that reduces risk.
Most nutrients are multi-functional, with response curves varying by system (such as skeletal vs immune) and nutrient responses varying with basal nutrient status, dose/intake, and system-specific sensitivity.
A few key points to consider:
- The benefit rises as intake rises up to a certain point (away from deficiency, and before toxicity).
- Within the curve are null response regions; too low will not be enough to produce a response, and too high will not produce any further response (response has been maximized).
- The same dose may produce a significant response in one system and a null response in another.
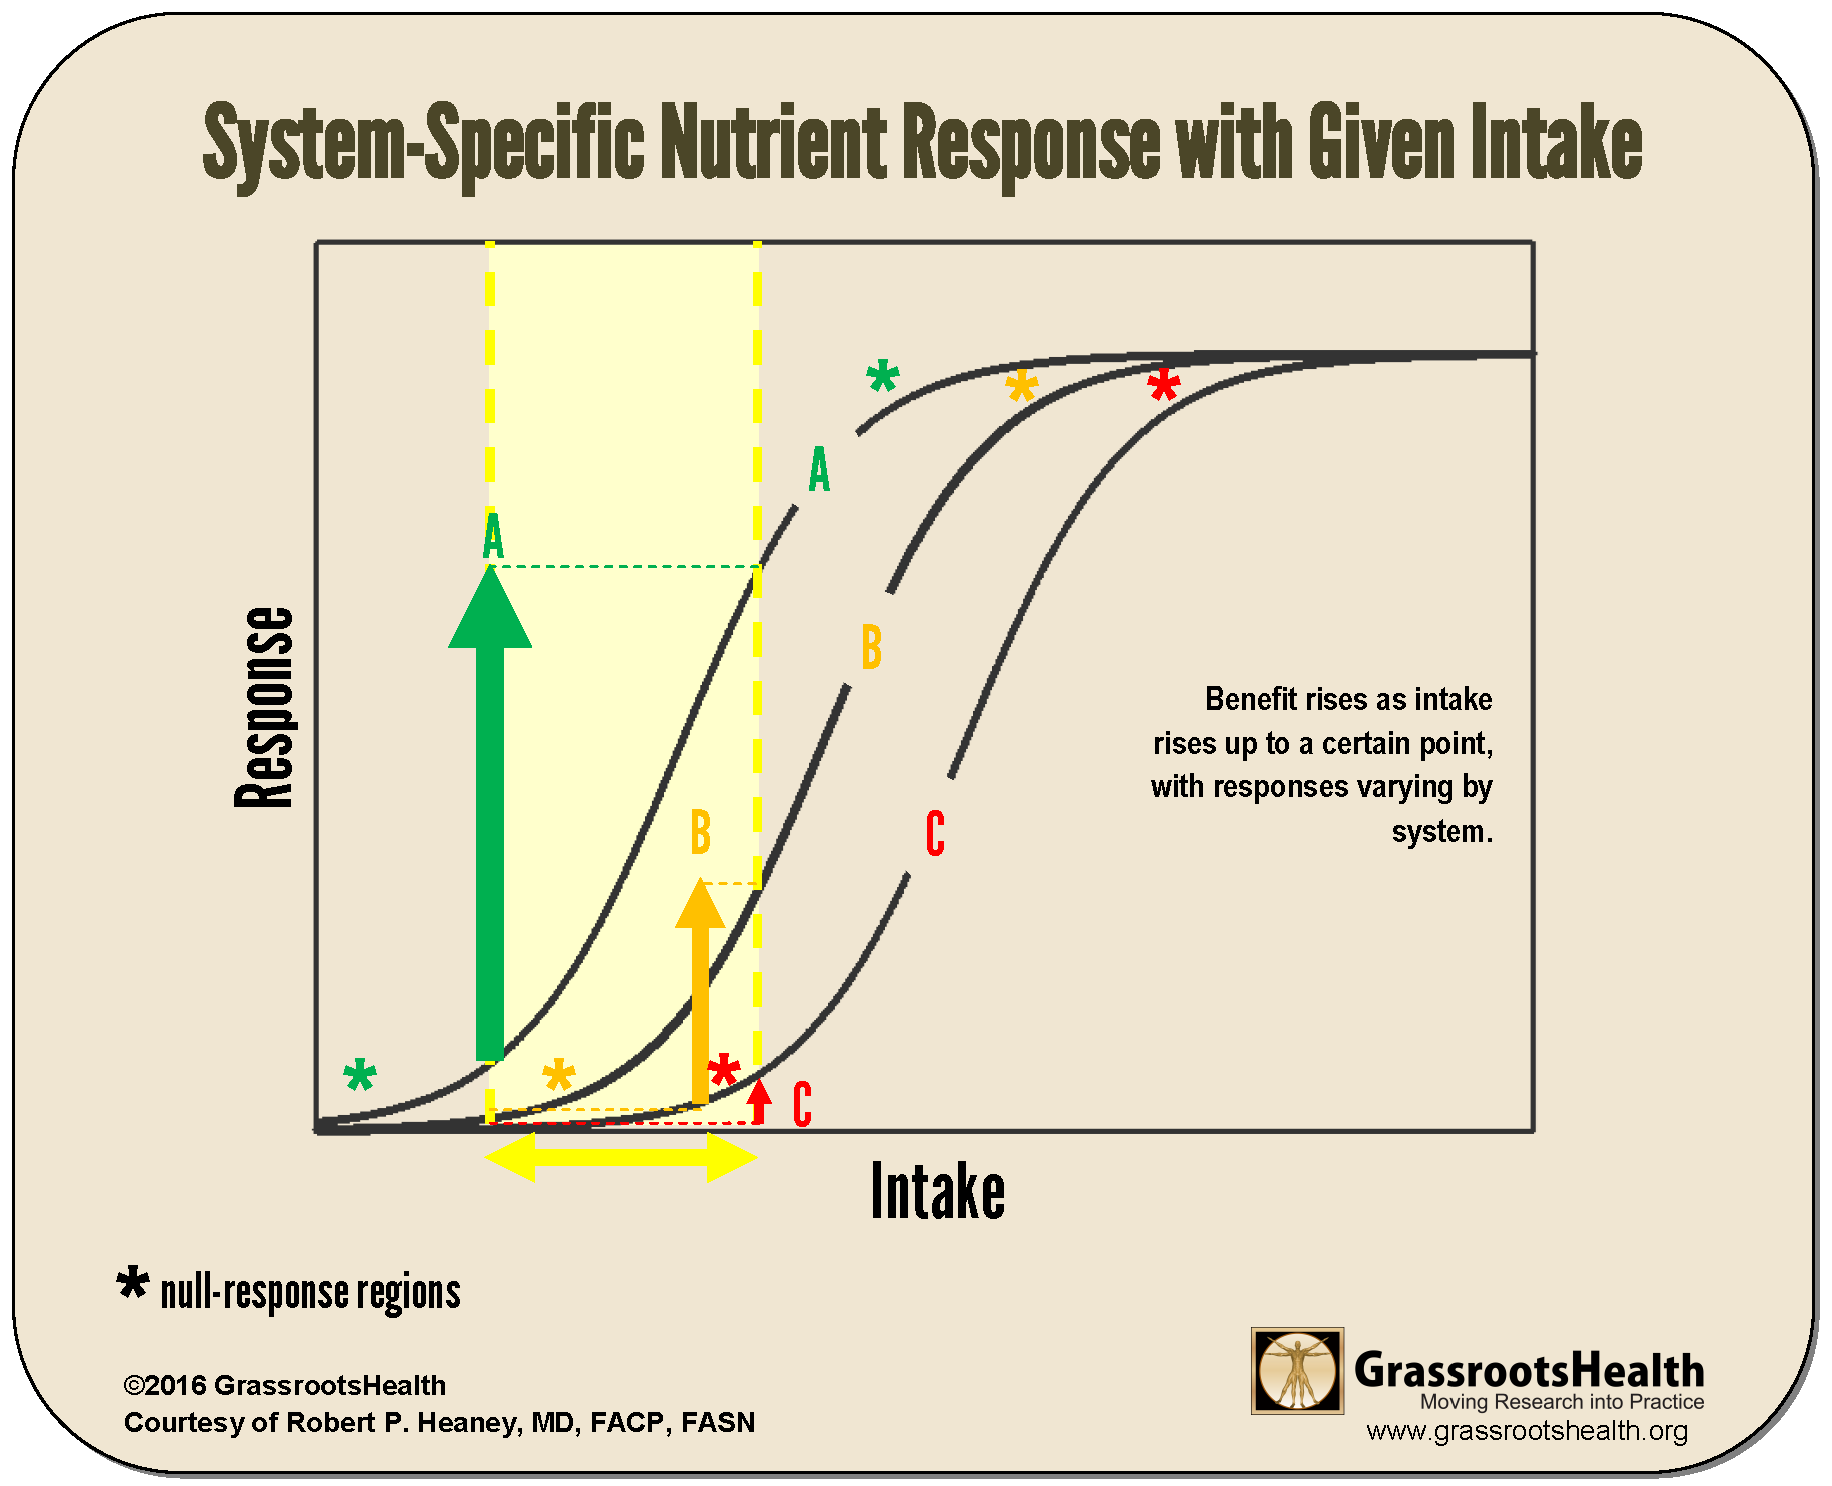
This next chart builds on this concept by illustrating that there may also be different, system-specific responses of a given nutrient to a given intake or dose.
Most nutrients are multi-functional, with response curves varying by physiological system-specific sensitivity (such as skeletal vs immune). The same change in a given nutrient’s intake will have varying effects in each system, as shown by curves ‘A’, ‘B’ and ‘C’. When considering a specific intake, that same dose may produce a measurable response in one system (as illustrated by the green arrow with curve ‘A’) and a null response in another system (as illustrated by the red arrow with curve ‘C’).
This variability in response by system can also be seen when referring to 25(OH) vitamin D serum levels, as shown by the Disease Incidence Prevention chart.
Are your nutrient levels where they need to be?
Make sure you know your nutrient levels, and see if you are in the target ranges for health (such as a vitamin D level of 40-60 ng/ml (100-150 nmol/L) and an Omega-3 Index above 8%). Find out your levels today! Log on to the shop (click the link below) to get your tests and see for yourself if your levels can be improved.
Make sure you track your results before and after, about every 6 months!
How can I track my nutrient levels and my health outcomes?
To help you track your nutrient levels and health outcomes, GrassrootsHealth has created an online tracking system called myData-myAnswers. You can also track your supplemental and dietary nutrient intake to see how they impact your nutrient levels. Check it out today!
How Can You Use this Information for YOUR Health?
Having and maintaining healthy vitamin D and other nutrient levels can help improve your health now and for your future. Measuring is the only way to make sure you are getting enough!
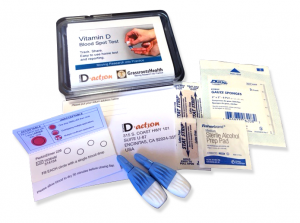
STEP 1 Order your at-home blood spot test kit to measure vitamin D and other nutrients of concern to you, such as omega-3s, magnesium, essential and toxic elements (zinc, copper, selenium, lead, cadmium, mercury); include hsCRP as a marker of inflammation or HbA1c for blood sugar health
STEP 2 Answer the online questionnaire as part of the GrassrootsHealth study
STEP 3 Using our educational materials and tools (such as our dose calculators), assess your results to determine if you are in your desired target range or if actions should be taken to get there
STEP 4 After 3-6 months of implementing your changes, re-test to see if you have achieved your target level(s)
You may also like
 Here We Go Again (Part 2 of 3) – Did the VITAL Analysis Meet the Nutrient Study Criteria for Fracture Rates?
 Nutrient Reference Range vs Optimal Range
 “Smiley Curves” Illustrate the Association between UVB Availability and Disease Incidence
 Reducing COVID-19 Risks and Improving Patient Survival – A Summary of Research on Vitamin D, Other Nutrients & Immune Health