Published on May 23, 2019

![]() One of the key factors in personalizing your sun exposure is knowing the UV Index in your area so that you don’t burn. The UV Index is a measurement of the strength of the sun’s UV rays at a particular place and time. We have touched on the UV Index in previous posts but today’s blog provides more information about how the UV Index is determined, how it changes throughout the day and year, and how you can use it as a tool to plan your daily sun exposure.
One of the key factors in personalizing your sun exposure is knowing the UV Index in your area so that you don’t burn. The UV Index is a measurement of the strength of the sun’s UV rays at a particular place and time. We have touched on the UV Index in previous posts but today’s blog provides more information about how the UV Index is determined, how it changes throughout the day and year, and how you can use it as a tool to plan your daily sun exposure.
What is the UV Index and how is it determined?
The UV Index is a standardized linear scale with higher values representing more intense UV radiation and a greater risk of sunburn. In general, the amount of time that can be spent in the sun before burning is proportional to the UV Index – twice the UV Index, half the time in the sun. For example, if an individual begins to sunburn in 40 minutes at a UV Index of 5, they can expect to sunburn in 20 minutes at a UV Index of 10.
While UV intensity can be directly measured at a given location, it is most commonly calculated through a computer model that accounts for sun elevation and distance, cloud cover, air pollutants, reflection, ozone layer, and altitude. These calculations are then weighted towards the particular UV wavelengths that most affect human skin. An index of 0 occurs at night when there is no UV radiation and an index of 10 corresponds approximately to mid-day summer sunlight without cloud cover (values above 10 can be found in high altitudes, near the Equator, and locations with ozone layer depletion).
Factors that influence the UV Index
Many factors can affect UV strength such as season, latitude, time of day, altitude, and cloud cover. Additionally, reflection from snow, water, sand, or concrete can double the UV intensity, explaining why people often find that they burn faster at the beach than in their back yard. The maps below from the Environmental Protection Agency (EPA) show the UV Index measures across the United States for January and for July. In the contiguous states, UV Index measures are between 0 and 4 in the winter and between 4 and 11 in the summer.
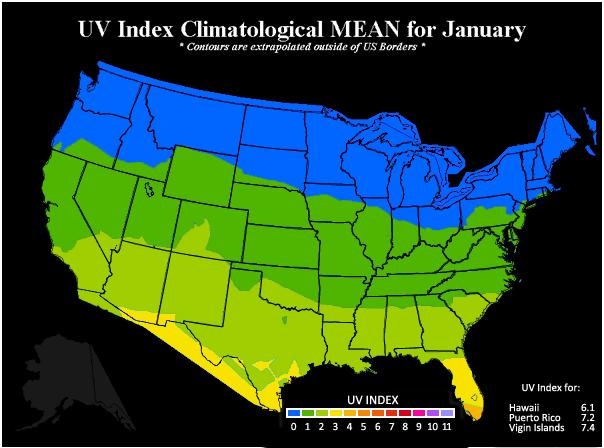
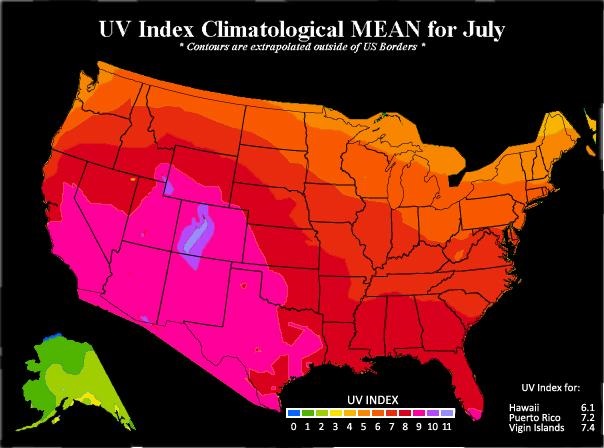
Environmental Protection Agency (EPA)
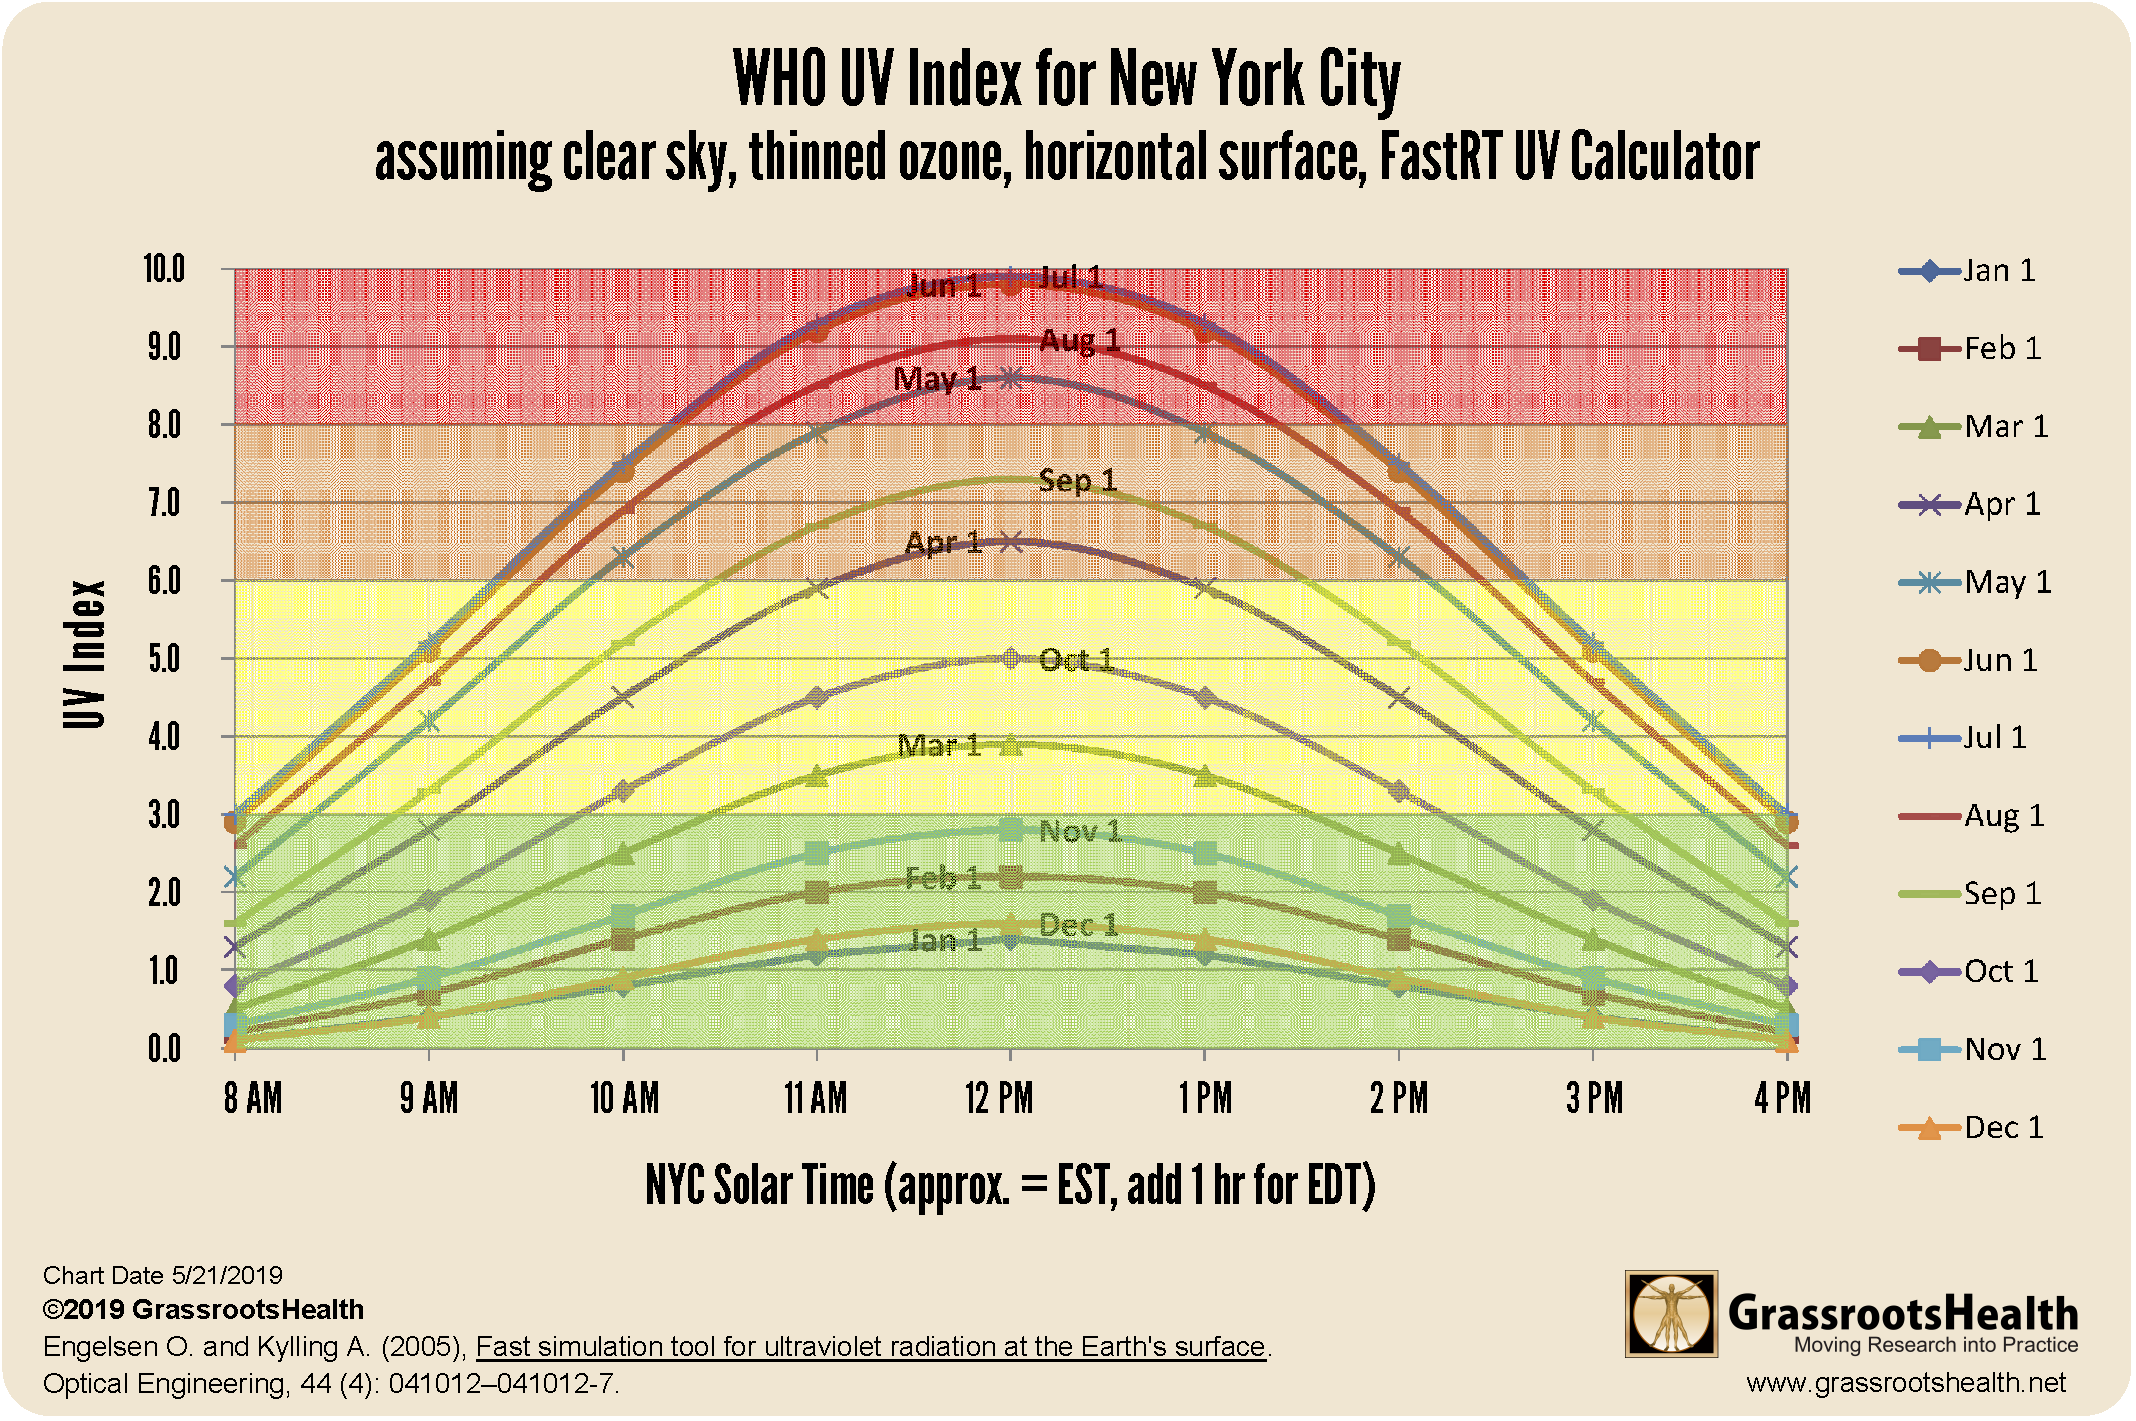
The chart below shows the typical variation of UV Index by time of day and time of year in New York City. As you can see, the UV Index varies widely based on the season and time of day.
How to use the UV Index to plan sun exposure
The UV Index can be found in daily weather forecasts or online. A daily UV Index represents the mid-day UV intensity when the sun is at its highest point (~12:00 pm or 1:00 pm with daylight savings time), which roughly corresponds with the primary time for vitamin D production (approximately 10 am to 2 pm). Hourly UV Index values are also available. Tools such as the free dminder app or SunFriend, a wearable UV monitor, can also be used to determine the current UV index.
Knowing the UV Index in your area during the time you plan to be outdoors, along with your skin type, can help you estimate the amount of time that can be spent in the sun before protection or cover is needed.
Are you using sun exposure as a source of vitamin D?
Is sun exposure helping to improve your vitamin D level? Make sure you know your vitamin D level, and see if you are in the target range of 40-60 ng/ml (100-150 nmol/L). Find out your levels today! Log on to the shop (click the link below) to get your tests and see for yourself if your levels can be improved. Use coupon code SunMonth to receive 15% off during Sunshine Month only!
Make sure you track your results before and after, about every 6 months!

Click Here to Access the Shop Page
How can I track my sun exposure and my vitamin D levels?
To help you track your sun exposure and vitamin D levels, GrassrootsHealth has created an online tracking system called myData-myAnswers. You can also track your dietary intake and supplement use to see how both sun exposure and vitamin D from food and supplements impact your vitamin D levels and your health. Check it out today!
How Can You Use this Information for YOUR Health?
Having and maintaining healthy vitamin D and other nutrient levels can help improve your health now and for your future. Measuring is the only way to make sure you are getting enough!
STEP 1 Order your at-home blood spot test kit to measure vitamin D and other nutrients of concern to you, such as omega-3s, magnesium, essential and toxic elements (zinc, copper, selenium, lead, cadmium, mercury); include hsCRP as a marker of inflammation or HbA1c for blood sugar health
STEP 2 Answer the online questionnaire as part of the GrassrootsHealth study
STEP 3 Using our educational materials and tools (such as our dose calculators), assess your results to determine if you are in your desired target range or if actions should be taken to get there
STEP 4 After 3-6 months of implementing your changes, re-test to see if you have achieved your target level(s)