Published on August 12, 2025

Vitamin D Deficiency in the U.S.: Still a Widespread Problem for Our Health and the Cost of Healthcare (Part 1)
Key Points
- Nearly two-thirds of Americans have insufficient vitamin D levels, with 2.6% severely deficient, 22% moderately deficient, and 40.9% insufficient; only 34.5% are considered sufficient, and even fewer have optimal levels (40–60 ng/ml).
- Non-Hispanic Black Americans, women, young adults, people tested in winter, those with low income or education, higher body weight, low milk intake, or sun avoidance are at higher risk of deficiency.
- Low vitamin D levels are linked to increased risks of infections, autoimmune diseases, diabetes, and some cancers, and are associated with higher hospitalization rates and medical costs.
- Supplement use does not always guarantee optimal levels; regular testing is essential to adjust doses and ensure sufficient vitamin D status.
 Even after decades of research and scientific evidence supporting the countless health benefits of vitamin D, it remains the number one nutrient deficiency in the world. Our health, our happiness, and our wallets, are paying for it.
Below is Part 1 of a short blog series in which we review the prevalence of vitamin D deficiency in the United States. Part 2 will cover the alarming costs of vitamin D deficiency in terms of time, happiness, and dollars; we will follow up by outlining the health consequences of vitamin D deficiency for this and future generations.
Millions of Americans are Vitamin D Deficient
Vitamin D deficiency is alarmingly common, with certain groups having a much greater risk. A 2022 analysis of U.S. National Health and Nutrition Examination Survey (NHANES) data from 2001 to 2018, by Cui et al. offers an up-to-date and comprehensive look at vitamin D status in the American population.
Analyzing data from over 71,000 people collected between 2001 and 2018, the study measured vitamin D levels in the blood [as serum 25-hydroxyvitamin D or 25(OH)D] and sorted them into four categories:
-

Click to Enlarge & Print
Severe deficiency: less than 10 ng/ml (25 nmol/L)
- Moderate deficiency: 10-20 ng/ml (25–50 nmol/L)
- Insufficiency: 20-30 ng/ml (50–75 nmol/L)
- Sufficiency: more than 30 ng/ml (75 nmol/L)

Based on their findings:
- 2.6% had severe deficiency
- 22.0% had moderate deficiency
- 40.9% had insufficiency
- Only 34.5% had sufficient vitamin D levels (at least 30 ng/ml)
To give an idea of how these percentages translate to the number of individuals in the United States today, using data from census.gov, there were approximately 336.5 million people ages one year and older living in the U.S. in 2024. Using this approximation,
- 8.8 million people had severe deficiency
- 74 million had moderate deficiency
- 137.6 million had insufficiency
- Only 116.1 million had sufficient vitamin D levels
REMEMBER: Optimal vitamin D levels for the general population are between 40-60 ng/ml (100-150 nmol/L), which means even fewer individuals have optimal levels than those labeled as sufficient above.
While the rates of moderate deficiency and insufficiency have dropped slightly since 2001, the percentage of people with severe deficiency hasn’t budged.
Chances are Worse When it Comes to Optimal Vitamin D Levels
In 2020, GrassrootsHealth completed our own analysis of the National Health and Nutrition Examination Survey (NHANES, 2009-2014) data to look at rates and trends of vitamin D deficiency in the United States in both adults and children and how it compares to the GrassrootsHealth cohort (US participants who tested anytime in 2009 through 2014). In doing the analysis, we expanded our comparison groups to include those with optimal vitamin D levels (40-60 ng/ml or 100-150 nmol/L), as well as those with levels of 60 ng/ml or higher. Below are a couple of pie chart illustrations, based on that data, of vitamin D levels in the US population, compared to the levels of participants in the GrassroostHealth cohort.
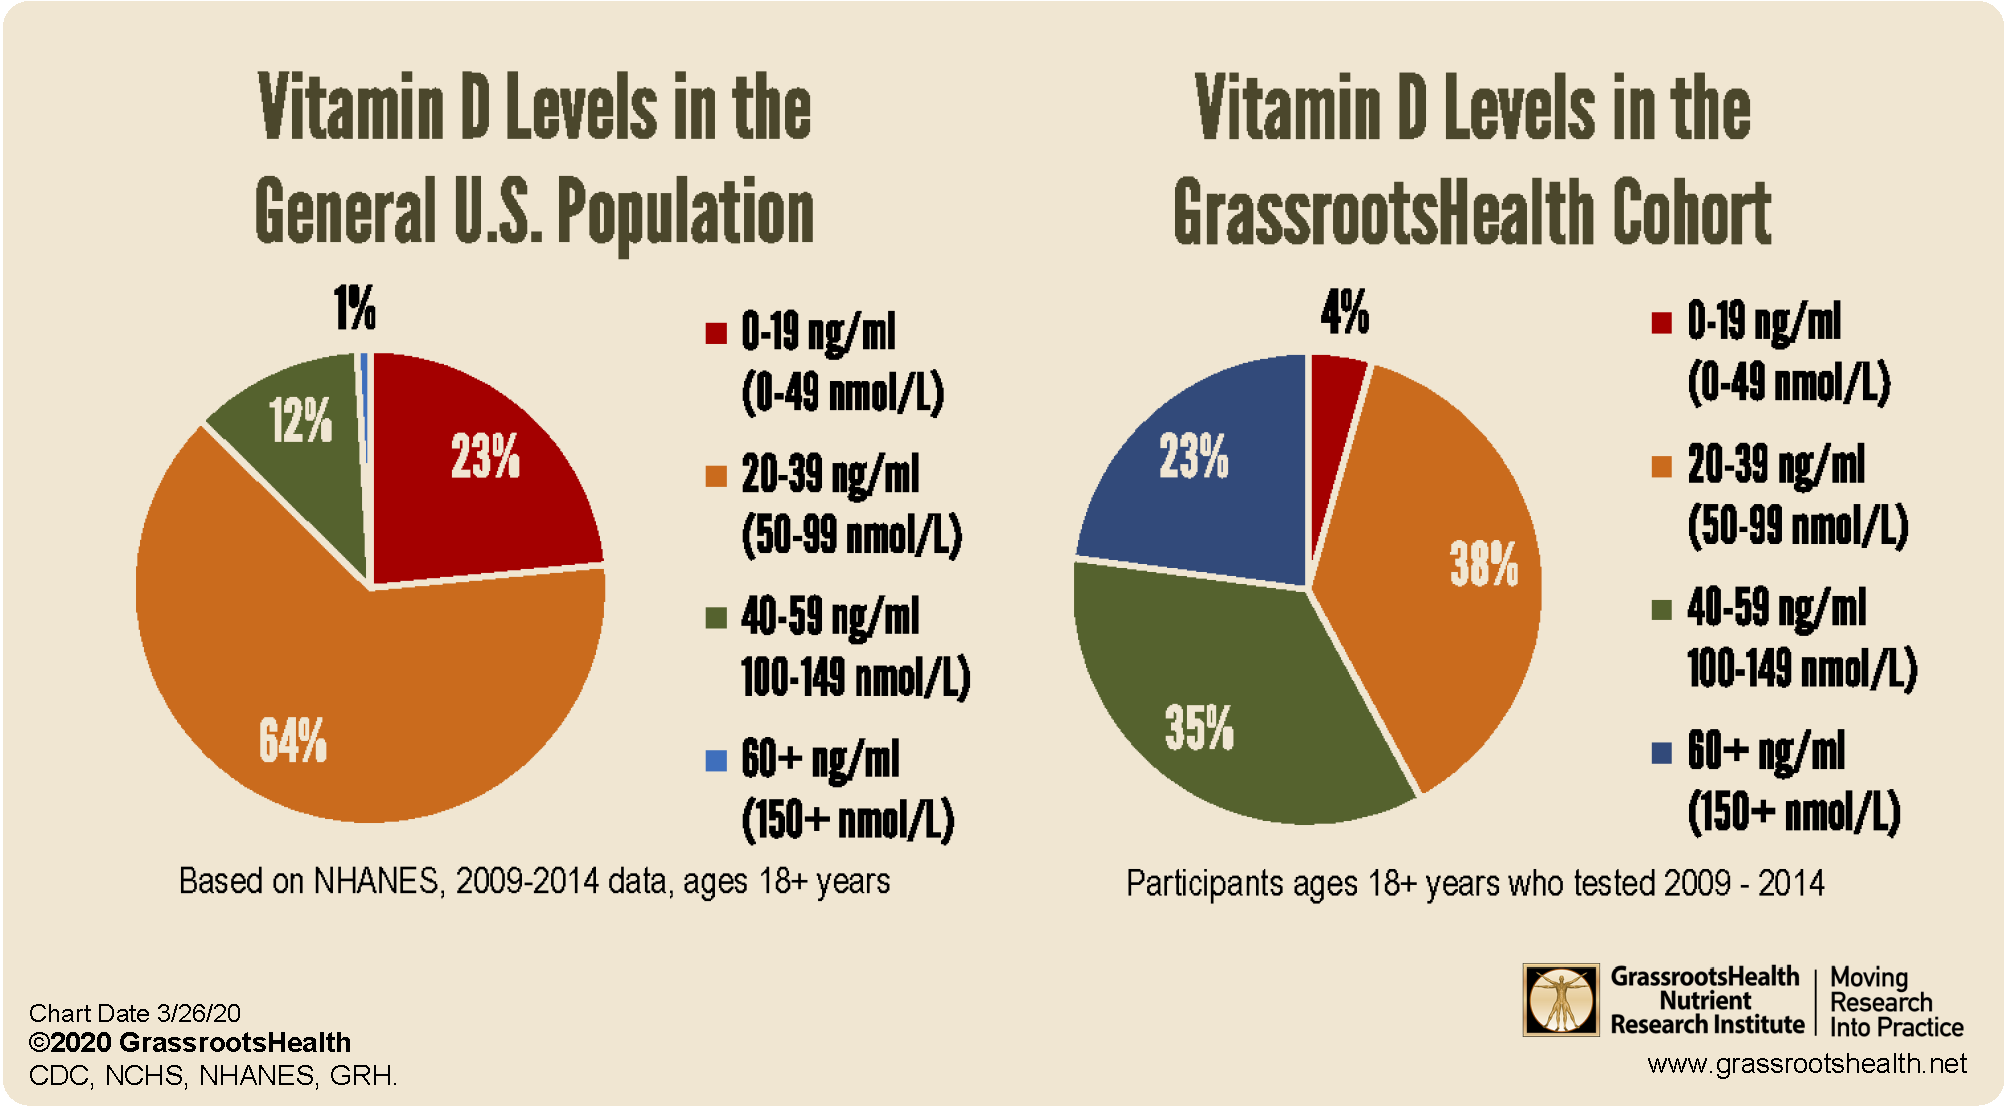
The pie charts above clearly show the difference in distribution in vitamin D levels among adults. Almost 90% of U.S. adults in the NHANES data set have a vitamin D level below the recommended range of 40-60 ng/ml. Those in the GrassrootsHealth cohort have significantly higher levels than those in the NHANES cohort; yet approximately 42% of GrassrootsHealth participants were also below that range.
Who’s Most at Risk?
Some groups were far more likely to be vitamin D deficient:
- Non-Hispanic Black Americans – due to higher melanin levels, which reduce vitamin D production from sunlight
- Women
- Young adults (20–29 years old)
- People tested in the winter
- Those with low income, lower education levels, or higher body weight
- People who rarely drink milk or regularly avoid the sun with clothing or shade
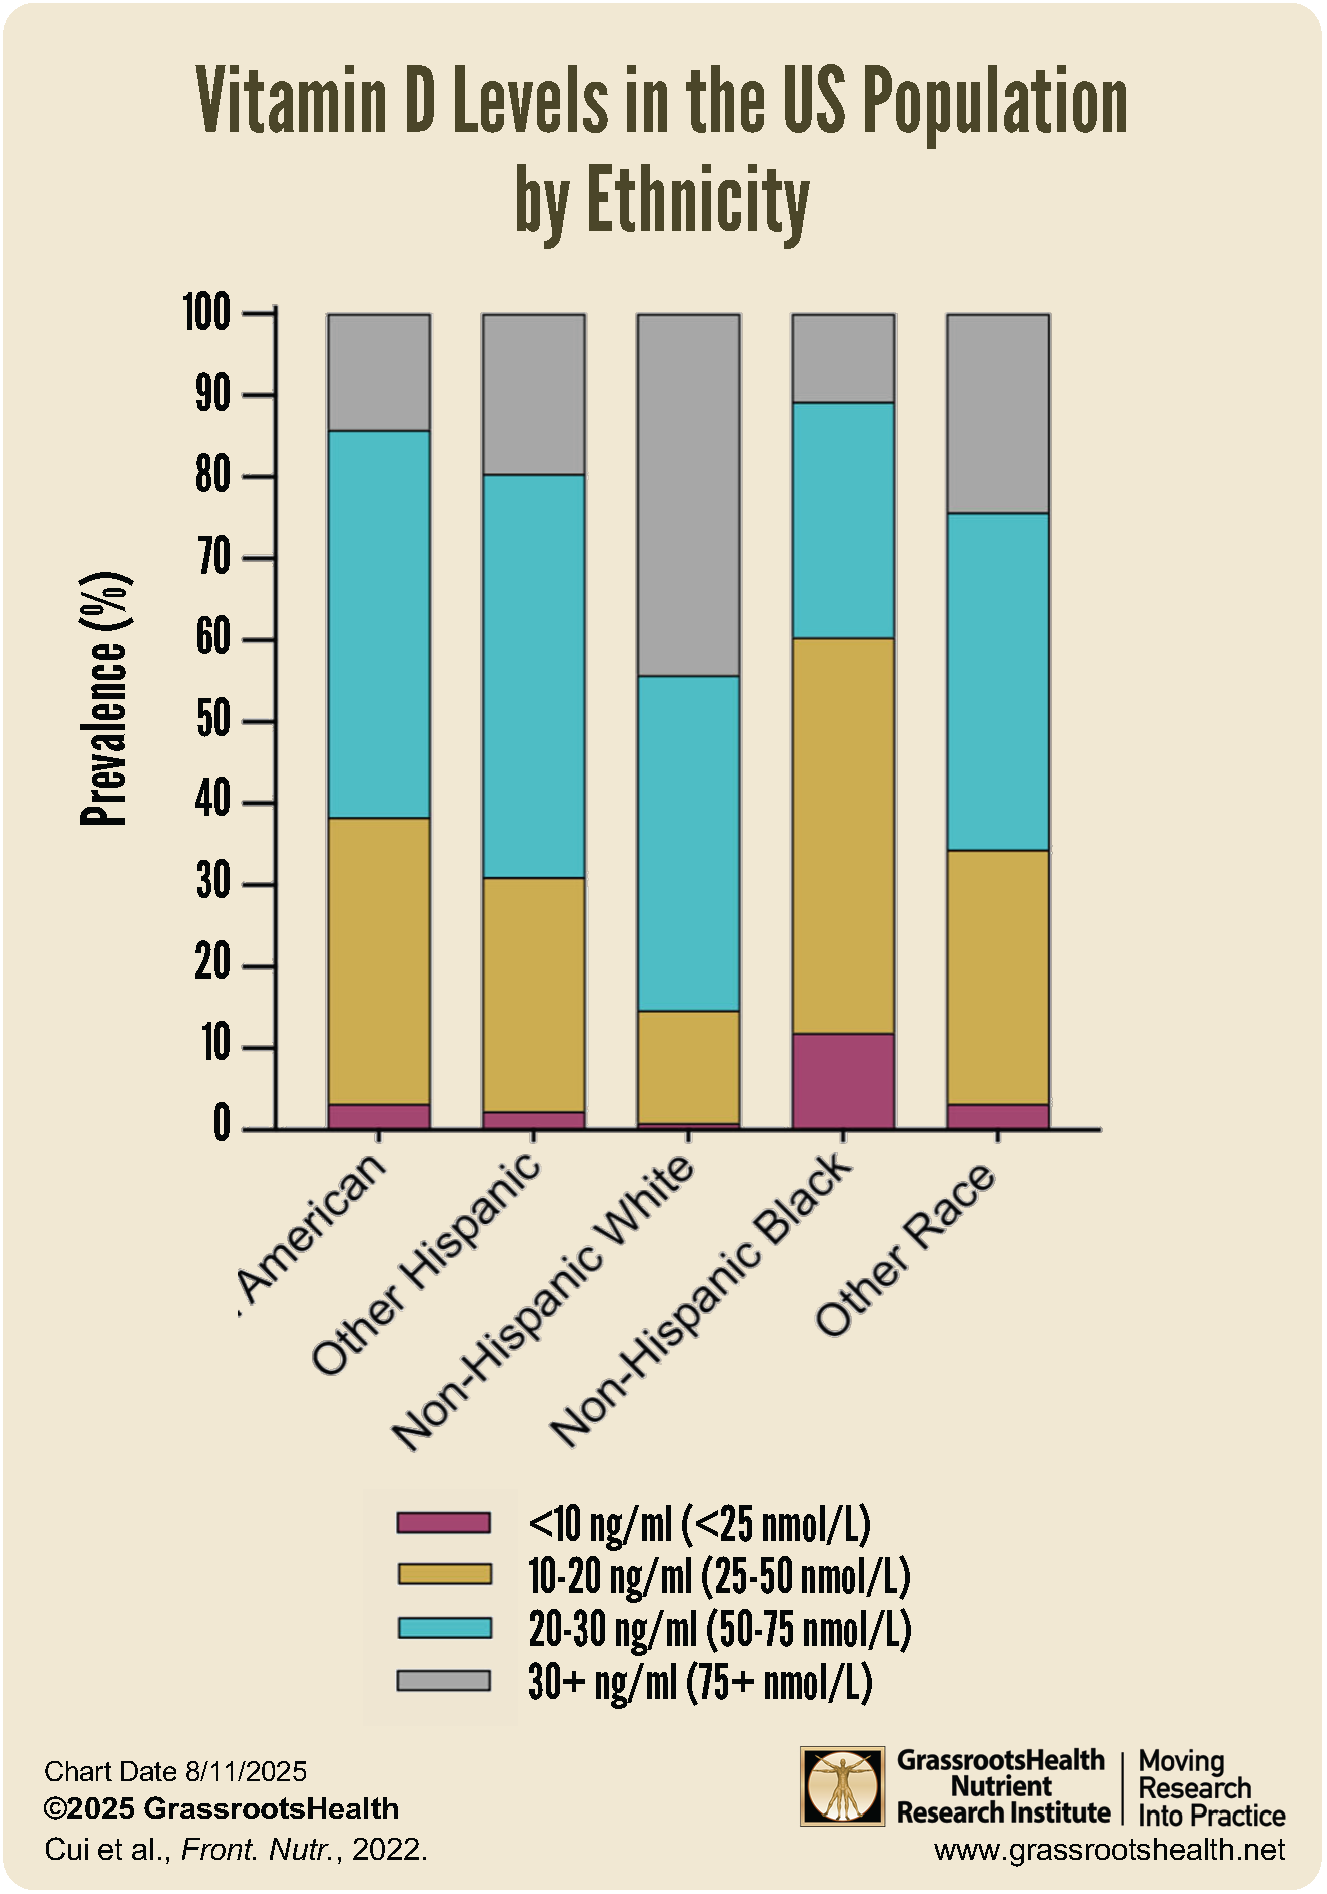
The bar chart above shows the increased prevalence of vitamin D deficiency and severe deficiency among different ethnicities. Interestingly, frequent sunscreen use was linked to a lower risk of deficiency, likely because sunscreen users tend to spend more time outdoors overall.
Another study by Bailey et al. (2012) found that the risk of vitamin D deficiency also varied significantly based on rurality.
- Large metro residents were 49% more likely and rural residents were 20% more likely to be vitamin D deficient compared to urban residents
- Both rural and large metro residents had higher medical costs, and they were significantly more likely to be hospitalized
- Vitamin D levels explained a statistically significant amount of the relationship between rurality status and medical costs/service utilization
Why This Matters
Vitamin D is more than just a “bone health” nutrient. It plays key roles in gene regulation, affecting immune function, muscle health, and disease prevention. Low levels have been linked to higher risks of infections, autoimmune conditions, diabetes, and even some cancers.
Despite small improvements in vitamin D sufficiency, the fact that nearly two-thirds of Americans still don’t have sufficient levels shows there’s still a long way to go. Public health strategies such as promoting regular monitoring of vitamin D levels, correct supplementation, safe sun exposure, and foods higher in vitamin D are still urgently needed.
Supplementation Does Not Always Provide Expected Change
Why not just take a supplement? There is no single dose to best fit everyone, as everyone responds differently to vitamin D. Among 5,442 GrassrootsHealth participants who completed at least two vitamin D tests, approximately half (51%) achieved 40 ng/ml on their first test compared to two-thirds (67%) on their second test – leaving 1/3 of those who re-tested still below the 40 ng/ml target level.
Additionally, we often need to adjust the dose we are taking to suit our bodies’ needs and the only way to know that is to measure. The median vitamin D supplement intake amount increased from 2000 IU/day on the first test to 4000 IU/day on the second test. Among those who were less than 40 ng/ml on their first test, a majority increased their supplemental intake amount (76%) and their vitamin D level (81%) between their first and second tests.
The Takeaway: Measure Your Vitamin D Level
If you haven’t had your vitamin D levels checked recently, now is the time! With so many Americans still falling short, awareness is the first step toward change.
Measuring your vitamin D level and calculating a supplementation amount to help reach and maintain a target level, or taking loading doses to correct deficiency faster, could possibly make all the difference in overall health, wellbeing, and how a current disease situation progresses. Test your level now!
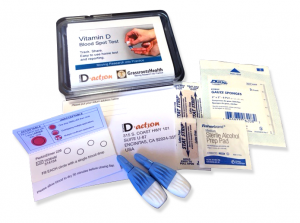
Create your custom home blood spot kit by adding any of the following measurements, along with your vitamin D:
- Omega-3 Index (with or without Ratios AA:EPA and Omega-6:Omega-3)
- Magnesium (with additional Elements copper, zinc, selenium, mercury, and cadmium)
- hsCRP as a marker of inflammation and HbA1c as a marker of blood sugar health
Having and maintaining healthy vitamin D levels and other nutrient levels can help improve your health, now and for the future. Enroll and test your levels today, learn what steps to take to improve your status of vitamin D (see below) and other nutrients and blood markers, and take action! By enrolling in the GrassrootsHealth projects, you are not only contributing valuable information to everyone, you are also gaining knowledge about how you could improve your own health through measuring and tracking your nutrient status, and educating yourself on how to improve it.
How Can You Use this Information for YOUR Health?
Having and maintaining healthy vitamin D and other nutrient levels can help improve your health now and for your future. Measuring is the only way to make sure you are getting enough!
STEP 1 Order your at-home blood spot test kit to measure vitamin D and other nutrients of concern to you, such as omega-3s, magnesium, essential and toxic elements (zinc, copper, selenium, lead, cadmium, mercury); include hsCRP as a marker of inflammation or HbA1c for blood sugar health
STEP 2 Answer the online questionnaire as part of the GrassrootsHealth study
STEP 3 Using our educational materials and tools (such as our dose calculators), assess your results to determine if you are in your desired target range or if actions should be taken to get there
STEP 4 After 3-6 months of implementing your changes, re-test to see if you have achieved your target level(s)